Consultivo Blog | Research, Study & Analytics |Socio Economic Survey
Business insights help leaders, managers and decision-makers to make better decisions for organisations across the industry. Find out how statistics, data science and machine learning help us to get data insights for business.
Business insights are easy to ask for but rare to find. In fact, it is further difficult to transform the data insight into business value.
If we look at the past, we had statisticians and analysts in the Research and Development (R&D) team or Management Information Service (MIS) team who would look at the data, analyze and interpret them.
With the passing days, there is a greater need for agile decision making. Long gone is the time when data research & analytics was only restricted to the R&D departments of companies and tech startups. Now we find the requirement of technology-enabled analytics dashboards in every team of the organisation.
With the accelerated technological change and an anticipated drop in the cost of Internet of Things (IoT) nodes like microcontroller units and sensors, there is a vast amount of data available. Even the use of big data in business process and solutions is a reality now for many establishments.
Data insights – By 2025, it is estimated that
463 EB (Exabytes) of data
will be produced every day.
The data-storage capacity has also drastically increased. Here, the data insight can be funnelled as per the organisation’s requirement: sector, function, activity, geographical location, risk appetite, technological maturity etc.
The business practices across the industry are going through a transformation with the rising need for measuring, quantifying and visualising the data insights.
As data grew, the analysis and interpretation became longer and longer. The result? Confusions. Lack of clarity. Lack of action points. And a waste of time and resources for the purpose of finding business insights.
Seemed like the analysis became just a dump of data on decision-makers which is asking them to fend for themselves.
So, what type of business insights will bring the solutions to life?
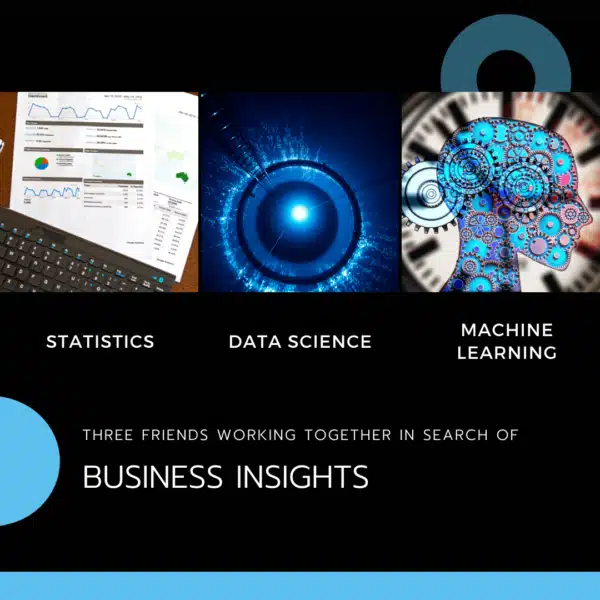
For understanding this, here is the analogy of three friends working together to find data insights and we can call them business insights eventually.
Let us begin by getting to know the first friend. This friend has been extremely close to us since our school days – the subject we call Statistics.
Consultivo is one of the leading Social Research Agencies in India, and provides complete range of research & analytics solutions like Social Surveys, ESG Research, Independent CSR Impact Assessment, Social Impact Assessment, Need Assessment Study, Baseline Survey, Stakeholder Mapping and Engagement, CSR Project Monitoring and Evaluation (M&E), Sustainability Research Projects, Employee Engagement and Perception Surveys and many more.
It starts with the collection of data, followed by organising, analysis, interpretation, and finally, presentation of data. In fact, statistics remain the key player in the whole process of finding data-driven insights.
The mathematical formulas and techniques when used for the statistical samples, it creates the data experience for providing interpretations.
Early writings on statistical interventions can be traced back to Arab mathematicians and cryptographers during the Islamic Golden Age (eighth to the thirteenth centuries).
A statistician’s/analyst’s role broadly involves solving a specific problem with a given dataset using experimental design, research & surveys, creating estimations, sorting the statistical findings etc.
However, the volume of data continues to grow more than 50% a year for organizations across the private and public sectors as information pours in from digital platforms, wireless sensors, virtual-reality applications, and billions of mobile phones.
As a consequence, businesses are facing the crucial challenge of managing, analyzing and interpreting all that data.
90% of the data we are having today was created from the last two years.
In this context, businesses are diving deep into space where most of the data remain unexplored and has not been analysed till now. That’s known as “dark data”.
With reference to our analogy, to bring out business insights, Statistics is now looking for help – looking for someone beyond the capacity of statistical computation. So comes the second friend – Data science.
Data science – Science of deriving insights from data with the help of machine learning
Data Science is used in many organisations across the industry to make better business decisions, and in the sciences to test models or theories.
This requires a four-step process containing:
Data inspecting or data reading
This is basically the first step to pull data into the programming platform from multiple data formats (eg. excel sheet, Google sheet, pictures, infographics etc).
Data processing and cleaning
Once you bring the data in, it’s time to process and find out the errors in the data. Eg. Some variables/values might be missing or invalid in the dataset. That needs to be fixed and cleaned in this step.Summarising data
In this step, the data is now computed with statistical tools and formulas.Data visualisation
Here the data is presented visually – plotting the data to bring the highlight of some of the attributes at a glance (Rg trends, relationships, correlations etc). This step is essential before integrating the heavy-duty algorithms.Data science encompasses
computer science and business concepts, It goes beyond a set of techniques and principles.
What’s new that data science is bringing to business insights?
- Automation
use of SQL querying for data collection
machine-learning libraries like sklearn and TensorFlow
use of Python and R programming languages
deployment of automated models (into an app)
focus on software engineering practices software-engineering like coding and automation of machine learning models
Data Science is the science of analyzing raw data using statistics and machine learning techniques with the purpose of drawing conclusions about that information.
With this increase in the requirement of data insights, roles like data scientist, data engineer, data analysts, machine learning specialist, cloud architect, analytics software engineer are in high demand. They are using computing power and devising algorithms that are ever more sophisticated through better tools, automation, and collaboration to bring out the business insights.
In continuation to our analogy, here comes the third friend – Machine Learning (ML). Well, this friend, Machine Learning (ML) has got a legacy as it belongs to the family of Artificial Intelligence (AI).
With very large datasets, Machine Learning enables advances in the field of Artificial Intelligence (AI). AI brings the ability of a machine to perform human cognitive functions (like perceiving, reasoning, learning, interacting with the environment, problem-solving, and even exercising creativity).
Machine-learning algorithms detect patterns and learn how to make predictions and recommendations. By processing data and experiences, ML replicates or mimic human intelligence. With time, the algorithms get updated and it adapts in response to feed – new data and experiences.
Robotics and autonomous vehicles, computer vision, language, virtual agents, and machine learning are a few of the examples of technologies that uses AI to bring business insights.
Machine-learning techniques, such as deep learning, random forest, and XGBoost, are now common at top risk-analytics departments. The new tools radically improve decision models. And techniques such as natural-language processing and geospatial analysis expand the database from which banks can derive insights.
What major problems does ML solve for decision making?
1. Classification problems
2. Function approximation or Regression problems
Machine Learning Techniques to find business insights Type – Prevalent use (modulo grey areas)
- K-nearest-neighbour – classification & function approximation
- K-means clustering – classification
- Linear discriminant analysis (LDA) – classification
- Logistics regression – classification
- Linear regression – function approximation
- Support vector machines – classification
- Decision trees and random – classification & function approximation
- Principal component analysis – function approximation
- Quadratic discriminant analysis (QDA)
- Naïve Bayes classifier – classification
- Hierarchical clustering – classification
- Neural networks – classification & function approximation
In a survey,
60% of the senior executives and other managers have reported visible impact by investment in AI.
As of 2021,
the top 5 types of industries reporting positive impact from AI in the last 3 years are Technology and IT, Energy, Professional services, Health and pharma, Telco and media.
So when we talk about solutions curated with business insights, I like to draw this analogy of these 3 friends – Statistics, Data Science and Machine Learning
To continue with it, what do we see when they are working together to bring out business insights?
When we see Statistics, we see the age-old time tested fundamental concepts of quantification and analysis to bring out data driven insights.
When we see Data Science, we see the agile scientific approach to analyse data with technology. We’ve witnessed its metamorphosis into the world of big data and Artificial Intelligence.
And when we see Machine Learning, we find the curiosity to mimic human intelligence and behaviour to solve problems related to business insights with the massive data set.
These three friends have brought a disruptive transformation across the globe. We see the positive impact across the industry using advanced analytical techniques, embedding AI, making use of machine learning and predictive analytics.
While we are overwhelmed to capture as much data and get as many business insights as possible, not all of it is on our priority list of action points. Here comes the need for the core subject matter expertise, relevant domain knowledge, understanding the user experience and more ‘human factors’ to curate the solutions.
It begins with excellence in identifying, capturing, and storing that data; moves through the technical capability to analyze and visualize that data.
These three friends help each other to find out the best of the business insights and provide us with the same. That’s the starting point of digital transformation to bring data insights into the business.
Share this post
Category: Blog
About the author
Lead – Communication, Consultivo
Medha Basu currently serves as the Lead – Communication at Consultivo (www.consultivo.in). In her role, Medha primarily works on communication, engagement, first mile activities and data analytics.
She is having 5+ years of experience in the sustainability consulting and advisory sector. As a communication professional, she knows perfectly what it takes for successful communication.
After her studies, Medha started her career with digital engagement and business communications. She picked up the flair of sustainability communication with a diverse exposure with 100+ sustainability solutions
Related insights
View more in Impact Stories | Blogs | Knowledge Bank | News and Events


